Showing posts with label Spreadsheets/Calculators. Show all posts

Saturday, November 28, 2020

Back-of-the-Envelope Retirement Savings Calculator

This is my really simple "back-of-the-envelope" retirement calculator. It reduces retirement planning calculations to the bare minimum.

Accounting for all of the variables in retirement planning requires a complicated model. In this post, I've made some simplifying assumptions. I've tried to develop a "bare bones" model so that we can focus better on the big picture, and still get results that are useful.

The Observations Back-of-the-Envelope Retirement Savings Calculator


Notes: Enter data only in the peach cells. You can use the arrows and sliders on the side and bottom of the calculator to scroll. On some phones you may need to double click to enter data; it may also be helpful to switch to landscape mode. On some computers, you may have to enter some fields more than once for it to "take." 
Please leave a comment if you are having problems.

How Much Money Will You Need to Retire?

The key simplifying assumption was to estimate the savings you will need at retirement using

Thursday, April 18, 2013

What Will $1 be Worth in the Future? (calculator)


This calculator:

  • Converts current prices to equivalent prices any number of years in the future
  • Compares purchasing power today to purchasing power in the future
Enter an amount, how far into the future you want to compute, and the inflation rate you want to assume.  Below we see that at 5% inflation for 20 years, an item that costs $100,000 now will cost over $265,000.  That means that 20 years from now the purchasing power of $100,000 will have been reduced by over 62%; $100,000 then will only be able to buy what we can buy now for about $37,000. Be sure to enter inflation percentages as decimal amounts -- that is, 0.05 for 5%, 0.025 for 2.5%, etc. 


Notes: Enter data only in the tan cells. On some phones you may need to double click to enter data. On some computers, you may have to enter some fields more than once for it to "take." Please leave a comment if you are having problems.

Saturday, March 9, 2013

How Much Will Your Bond/CD be Worth in N Years? (calculator)

This Calculator Computes the Future Value of Your Bond/CD for Any Amount, Number of Years, and Interest Rate


Enter data only in the colored cells below.
Note: normal/annual compounding is once a year; semi-annual is 2 times/year; quarterly is 4 times/yr; etc. Be sure to enter interest rates as decimal amounts - 0.03 for 3%, 0.025 for 2.5%, etc.


Saturday, February 9, 2013

Inflation Calculator: Convert Dollars from 19xx to Now

Last updated Sept. 2020

Convert Dollars From One Year to  Equivalent Dollars in Another Year
Calculate Inflation Rates Between Two Years


This calculator is especially useful for converting salaries and asset values.

The brown/tan cells are input fields. For example, enter the start and end years and immediately see the inflation rate between the two years. Enter a price and convert between the start year price and end year price (e.g., from 1900 to 2019 dollars -- or vice versa).


Notes: On some phones you may need to double click to enter data. On some computers, you may have to enter some fields more than once for it to "take." Please leave a comment if you are having problems.

Friday, January 25, 2013

What Will $100 be Worth in 10 - 20 Years?

This post estimates the future value of a dollar for the next 1-50 years, for inflation rates ranging from 1% to 10%. The chart works not just for $100, but for any amount -- $1, $1,000, $10,000, $100,000....  And, it works for 5, 10, 20, 30 ... anything up to 50 years. (This is a companion to a previous post which compares today's dollar to earlier years.)

Inflation is one of the biggest risks that current and future retirees face. Given today's life expectancies, even relatively low rates of inflation can devastate the purchasing power of a pension or uninvested cash during your retirement years. How great could the impact be? See below.

Try my new interactive future inflation impact calculator.  It does the same calculations as the graph below, but for any number of years, and for any inflation rate. Then come back to this post; graphs are still better for seeing the big picture.

What Will $100 be Worth in 5, 10, 20, 30... 50 Years?


What will a dollar be worth 5, 10, 20, 30 years from now in future?
What Will $100 be Worth in N Years?


The Impact of Inflation on the Future Purchasing Power of a Dollar

Over the last 100 years, U.S. inflation has averaged about 3%/year. As you can see from the graph above (click to expand), even at these apparently benign rates (the blue line), within 20 years the purchasing power of a fixed pension will be almost cut in half. Twenty years is not a long retirement these days; most advisors recommend that you plan for thirty. Some retirements last even longer.

Saturday, December 22, 2012

How Much Money Will You Need to Retire?

**Note: There is a newer version of this post here. **

This post uses the 4% withdrawal approach to calculate savings needed to retire at age 65 for those who earn from $10,000 to $250,000 or more and will be eligible to receive full, or nearly-full, Social Security benefits.

Previous posts established retirement savings benchmarks/targets from age 25 to 65 for a typical average income worker and a typical high-income worker. This post only calculates the target at age 65, and, as a result, is appropriate for all salary levels.


How Much Will You Need to Retire?


Retirement savings needed on retirement date at age 65
How Much Money Will You Need to Retire?


With an Average Salary, You'll Need Around 9 Times Your Salary to Retire

If you follow the 4% withdrawal guidelines, it's easy to calculate how much money you will need in order to retire at age 65. Basically, you will need (100%/4%=) 25 times the amount you expect to withdraw from your savings in your first year of retirement. To facilitate the computation, I have assumed that your total yearly spending in retirement will equal 75% of your current salary, adjusted for inflation.

However,

Saturday, December 15, 2012

How Much Should You Have in Retirement Savings? - average incomes

This post uses the "4% withdrawal" approach to retirement savings to estimate how much most people should have in savings -- by age.  And, given how much you actually have, what percent you should save going forward.

This post is designed for those earning approximately $40,000/year who are eligible for Social Security. Earn more? See higher income, or not eligible for Social Security.

Retirement Savings Targets for Those Eligible for Social Security


How much need in savings age 35, 40, 50, 60. 5-30 years before retirement
Retirement Savings Targets, by age


Have I saved enough for my retirement? Am I on track? Here's an easy-to-use graph to help those with earnings around $40,000/year plan for retirement. An earlier post calculated the percent of your salary you should save each year, depending upon when you start your retirement savings plan. This one provides some benchmarks to monitor your progress along the way.

Sunday, December 9, 2012

How Much Should You Have in Retirement Savings? - higher incomes

This post uses the "4% withdrawal" approach to retirement savings to estimate how much high-income earners should have in savings -- by age.  And, given how much you actually have, what percent you should save going forward.

Those With Higher-Salaries Need to Save More Than The Average

Have I saved enough for my retirement? Am I on track? Here's an easy-to-use graph to help those earning $100,000 or more plan for retirement; they need to save more than the average. An earlier post calculated the percent of salary that high-income earners should save each year, depending upon when they start their retirement savings plan. This one provides some benchmarks to monitor your progress along the way.

Retirement Savings Targets for Those With Higher Salaries


How much should I have in retirement savings at age 30, 35, 40, 45, 50, 55, 60 ...
Retirement Savings Targets for Higher Salaries

This post is designed for those earning $100k or more who are eligible for Social Security. Earn more? See targets for those not eligible for Social Security. Earn less? See typical Social Security recipients. Ending targets for all salary levels are covered in How Much Will You Need to Retire?

Sunday, November 25, 2012

Assumptions for the "4% Withdrawal Rate" Retirement Savings Graphs

Retirement planning: retire safely & comfortably using 4% initial withdrawal rate
The Observations posts based upon the Trinity Study / "4% Withdrawal Rate" guidelines for retirement savings include a short version of the assumptions made. This post discusses the assumptions underlying those graphs in more detail.  (See Related Materials below for a list of the posts.)

The Trinity Study (The "4% Withdrawal Rate" Approach to Determining Retirement Savings Needs)

The Trinity Study was a retirement study conducted by three finance professors from Trinity University. They assumed that, given today's lifespans, a safe retirement portfolio should be large enough to last for thirty years. Their methodology involved simulating the performance of a variety of stock/bond allocations using actual historical market performance data. Their research concluded that the most important factor in having retirement savings last that long was a realistic initial withdrawal rate. Further, they found that for a wide range of portfolios, a portfolio would have lasted 30 years more than 90% of the time if you started with a 4% initial withdrawal rate.

Thursday, November 22, 2012

How Much Should You Have in Retirement Savings? (by age)

In this post, we use the "4% withdrawal" approach to retirement planning to approximate how much you should have in savings at each age. And, given how much you actually have, what percent you should save going forward.

Have You Saved Enough for Your Retirement?

Have I saved enough for my retirement? Am I on track? These are critical questions for those hoping to retire in comfort. In the previous series, we calculated the percent of your salary that you should save each year. In this series, we provide some benchmarks to monitor your progress along the way.

Retirement Savings Targets as a Multiple of Salary: Benchmarks, by age


How much should I have in retirement savings
Retirement Savings Targets as Multiple of Salary
This post is designed for those who do not expect to receive a pension or Social Security -- regardless of salary level. Otherwise, see with Social Security, or higher income earners.

Without Social Security or a Pension, You'll Need ~19 Times Your Salary to Retire Comfortably at Age 65!


As you can see from the chart above (click to expand), no matter when you start saving, by the time you're 65 you'll need about 19 times your "then-current" salary in retirement savings! That is, assuming you want to maintain

Thursday, November 15, 2012

What Percent of Income Should High-Income Earners Save For Retirement?

Here's another easy-to-use graph that suggests the percent of your income to save for retirement depending upon the age you start saving. It's based upon the commonly used 4% withdrawal approach to retirement savings, and is designed for a high income wage earner planning to receive Social Security in retirement. Earlier posts targeted a typical social security recipient, and those without Social Security.

Some Benchmark Percents of Income to Save for Higher Income Earners with Social Security, by Starting Age


Retirement planning: what percent of salary should I save yearly (higher income w social security)
Annual Retirement Savings Percentage Needed (higher income)

Most people are not saving enough for retirement! Because of the way Social Security is designed, those with higher salaries need to save an even higher percentage of their salaries than the average person. Waiting too late to start planning & saving for retirement, or not saving enough, can be the difference between having a secure, comfortable retirement and a drastically reduced standard of living.

High Income Earners Should Plan to Start Early, and Save A Larger Percent of Their Annual Salary -- Even With Social Security

The previous post in this series benchmarked savings percentages needed for a typical worker with Social Security (and no pension). Unfortunately, the percentage of your salary that Social Security will replace decreases as your salary increases. As a result, higher income earners need to accumulate more years of salary in savings by their retirement date. Therefore, they should plan to save a larger percentage of their income than those with average salaries in order to reach the higher targets.

Thursday, November 8, 2012

What Percent of Your Income Should You Save For Retirement? (by starting age, with Social Security)

Here's an easy to use graph that suggests the percent of your income to save for retirement depending upon the age you start saving. It's based upon the commonly used 4% withdrawal approach to retirement savings, and designed for a typical wage earner who is planning to receive Social Security. Other posts address saving percentages for higher income earners, and those without Social Security. For other situations, see the end of this post.

Most people do not save enough for retirement. Sixty percent of older women have trouble covering their basic monthly expenses. Nearly half of Americans die with virtually no financial assets. Waiting too late to start planning & saving for retirement, or not saving enough, can be the difference between having a secure, comfortable retirement and spending your golden years in poverty.

Some Benchmark Retirement Saving Rates for Typical Employees with Social Security, by Starting Age


Retirement Planning:  what percent of salary should save -- by starting age
Annual Retirement Savings Percentage Needed (w Soc Sec)


Even With Social Security, You Will Need to Start Early, and Save A Significant Percent of Your Yearly Salary

The previous post in this series showed results for workers without a pension or Social Security. However, about 90% of American workers do have Social Security; it typically replaces roughly 40% of their pre-retirement income (not the at least 70% of pre-retirement income normally assumed to be needed). Even so,

Monday, October 22, 2012

What Percent of Your Salary Should You Save for Retirement? (by Starting Age)

Here's an easy-to-use graph that suggests the percent of your salary you should save for retirement depending upon the age you start saving. It's based upon the commonly used 4% withdrawal approach to retirement savings, and is independent of your salary. Waiting too late to start your retirement planning & saving, or saving too little, can make the difference between having a secure, comfortable retirement and spending your golden years in poverty.

What Percent of My Salary Should I Save for Retirement? Some Benchmarks by Starting Age


Retirement Planning: percent of salary to save each year -- by age you start saving
Annual Retirement Savings Percentage Needed
Note: This chart is for those who do not expect to receive Social Security. See also Percent to Save With Social Security, saving percents for higher income earners, and the final section of this post.

Start Saving & Investing When You Are Young, And Don't Invest Overly Conservatively

This graph (click to enlarge) proposes some benchmarks for those planning to retire without a pension or Social Security. While your specific circumstances may differ from what I have assumed (see "Key Assumptions" below), they won't change the basic messages that I think this chart sends, namely:
  • The earlier you start planning & saving for retirement, the better off you are (i.e., the less you will need to save each year)

Saturday, July 21, 2012

Interest Rate Forecast for 5-Year Treasury Notes

In this post, we forecast the yields for five-year treasury notes/bonds over the next five years using the same technique we used in an earlier post. In the earlier post, Where Are Interest Rates Headed?, we used the current yield curve to derive the yield curve as it is expected to be one, two and five years in the future. In effect, this post takes the results from that post and looks at them through a different lens.

Market Forecast of Five-Year Interest Rates for Next 5 Years


Interest rate forecast for 5-year U.S. Treasury Notes/ Bonds
Market Forecast of Five-Year Interest Rates

In the graph above (click to expand) the solid blue line represents five-year U.S. Treasury Notes. Year zero shows the "current" yield of 0.68% (To be consistent with the graph in the previous post, "current" is as of June 15, 2012). The remaining points show the expected yield on five-year treasuries from one to five years in the future. The expected yields were derived from

Friday, June 22, 2012

Where Are Interest Rates Headed?

This post describes a methodology for using the current yield curve to forecast future interest rates.

In the current economic environment, the direction of interest rates is a critical issue for many investors -- especially for retirees. You probably know that you can use the yield curve to forecast the direction of the economy. But, did you know that you can also use the current yield curve to forecast the shape of the yield curve one, two or three years or more in the future? Read on.

The Bond Market's Forecast of Interest Rates 1, 2 & 5 Years From Now

Future interest rate forecast: Yield curve 5 years from now
Market Forecast of Future Yield Curve/ Interest Rates


In the graph above (click to expand), the heavy black line is the current yield curve (as of June 15, 2012). The other three lines are the yield curves as they are expected to be 1, 2 and 5 years in the future. The shape of the future yield curves was derived directly from the current yield curve.  As you can see from the chart, the forecast is for rates to remain depressed, even as they rise gradually over the next five years. Two years from now (the green line), the one-year rate is forecast to be barely above 0.5%; five years from now (the dotted red line), the five-year rate is forecast to still be less than 3%.

Deriving Future Yield Curves From the Current Yield Curve

To understand how this model/spreadsheet works, consider the following. If we know the current one year interest rate and the current two year interest rate, we can calculate

Wednesday, December 21, 2011

My SIMPLE Retirement Saving Calculator /Spreadsheet

Note: This post has been replaced by a newer version.  See

This post introduces my "back-of-the-envelope" retirement model. I've reduced retirement planning calculations to the bare minimum.

It takes a complicated model to account for all of the variables in retirement planning. In this post, I've made some simplifying assumptions. I've tried to develop a "bare bones" model so that we can focus better on the big picture, and still get results that are in the right ballpark.

The Observations Back-of-the-Envelope Retirement Savings Calculator


Retirement planning: Excel spreadsheet to calculate what percent of salary to save
Notes: Click on the screenshot to expand it. 

How Much Money Will You Need to Retire?

The key simplifying assumption was to estimate the savings you will need at retirement using

Thursday, November 10, 2011

If You Had Invested $1 in the Stock Market in 19xx (graph thru 2012)

Want to approximate what $100 invested in the stock market in 1932 would be worth now? The graph below will help you estimate what $100, $1,000, $10,000 or any other amount would be worth if invested in 1932, 1982, 2002 or any other year -- assuming dividends were reinvested.

How Much Would $1 Invested in the Stock Market in 19xx be Worth Now contains a spreadsheet to make these calculations precisely -- along with several related computations (e.g. calculating the compound annual growth rate). However, you need Excel or some other spreadsheet software on your computer in order to use that spreadsheet. This post will help readers who do not have the necessary software approximate the results of the spreadsheet.

What If You Had Invested $1 in 19xx?


What would my investment in stock market be worth now? BOY 2013

The graph above (click to expand) shows that, for example, $1 invested at year-end 1928 is "now" worth

Saturday, August 20, 2011

How Much Would $1 Invested in the Stock Market in 19xx be Worth Now?

(last updated Sept. 2020)
How Much Would $1 Invested in the Dow Index in 19xx be Worth Now? This post addresses that question for any two years. The calculator works whether your initial investment was $1, $100, $10,000, or any other amount.

In addition, this calculator determines the average total yearly return (compound yearly growth rate) between the two years you input. Since total return includes reinvested dividends, it breaks out both the return attributable to dividends and the return resulting from price appreciation.

What If I Had Invested? -- The Observations Stock Market (Dow Index) Total Return Calculator


Just enter the starting and ending years, and starting investment amount. Optionally, you can enter an ending amount and find out what initial investment would have been needed to achieve that end result. You can use the arrows and sliders on the bottom of the calculator to scroll left and right. Enter data only in the gray cells. On some phones you may need to double click to enter data. On some computers, you may have to enter some fields more than once for it to "take." Please leave a comment if you are having problems.


$1 Invested in the Stock Market (Dow) in 1929

The graphic above shows the results of a hypothetical investment in the DJIA (Dow Jones Industrial Average Index) at year-end 1929. The assumption is that the investment was sold at year-end 2010, with

Monday, July 11, 2011

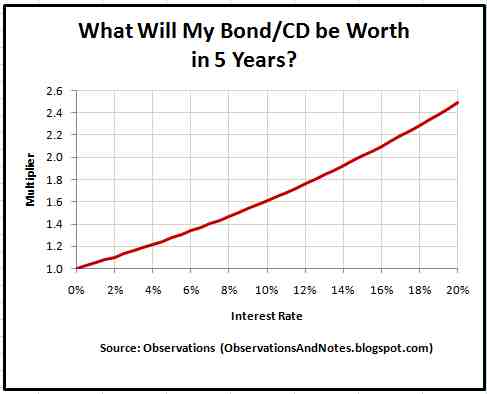
What Will My Bond or CD be Worth in 5 Years?

Here's an easy way to approximate what $5,000, $20,000, $50,000, or any other amount will grow to in 5 years. It works for bonds, CDs -- any investment that you expect to compound at a fixed annual rate. You can also use this graph to ballpark the results for multiples of 5 years -- e.g., 10, 15, 20 or 25 years.

NEW! Try my new interactive bond interest calculator. It does the same calculations as the graph below, but for any number of years, and for any interest rate. Then come back to this post; graphs are still better for seeing the big picture.

Because stock market results are not consistent, for stock market results see  the variability of 5-year stock market returns instead.

Approximates Results from the Calculator/Spreadsheet

The interactive bond calculator will give you precise results.  However, since the calculator may not work in some browsers, I'm providing this graph as a way to approximate the results.

What Will my Bond or CD be Worth in 5 Years?


5-year compound growth/ interest rate calculator/estimator for $5,000 $10,000 $15,000

The graph above (click to expand) shows how rapidly a bond or CD of any denomination will grow in five years. Given an interest rate, indicated on the horizontal axis, the "multiplier" on the vertical axis tells you what your investment will be worth in 5 years (assuming earnings reinvested each year, and no taxes). The multiplier is the same regardless of how much money you invest. For example,

Friday, May 13, 2011

What Would $10,000 in 19xx be Equivalent to Today?

Want to approximate what $1 in 1900 or 1929 or 1985 (or any other year) would be equivalent to today? How about what $100 or $1,000 today is equal to in past years? The graphs below will help you convert amounts in current 2012 dollars to amounts with the same buying/purchasing power in any prior year (beginning in 1900); you can also use it in the reverse direction. To see what today's dollar will be worth in the future, see What Will $100 be Worth 10 - 20 Years From Now?

NEW! Try my new interactive inflation calculator.  It does the same conversions as the graphs below, but you can convert from any year to any other year. Then come back to here; the graphs are still better for seeing the big picture.

I originally designed The Observations Inflation Spreadsheet to answer questions like the above, along with many other questions related to inflation and the impact of inflation on the dollar's purchasing power. The graphs below allow those without spreadsheets to approximate some of the spreadsheet's results.

What Was a Dollar in 19xx Worth vs. Today? e.g., What Was $10,000 in 1900 Equivalent to in 2012?


convert prior years dollar purchasing power to current 2012 dollars

The graph above (click to expand) converts dollar values from past years into their equivalent in today's dollars. For example,