Showing posts with label Investing - General. Show all posts

Thursday, April 18, 2013

What Will $1 be Worth in the Future? (calculator)


This calculator:

  • Converts current prices to equivalent prices any number of years in the future
  • Compares purchasing power today to purchasing power in the future
Enter an amount, how far into the future you want to compute, and the inflation rate you want to assume.  Below we see that at 5% inflation for 20 years, an item that costs $100,000 now will cost over $265,000.  That means that 20 years from now the purchasing power of $100,000 will have been reduced by over 62%; $100,000 then will only be able to buy what we can buy now for about $37,000. Be sure to enter inflation percentages as decimal amounts -- that is, 0.05 for 5%, 0.025 for 2.5%, etc. 


Notes: Enter data only in the tan cells. On some phones you may need to double click to enter data. On some computers, you may have to enter some fields more than once for it to "take." Please leave a comment if you are having problems.

Saturday, February 9, 2013

Inflation Calculator: Convert Dollars from 19xx to Now

Last updated Sept. 2020

Convert Dollars From One Year to  Equivalent Dollars in Another Year
Calculate Inflation Rates Between Two Years


This calculator is especially useful for converting salaries and asset values.

The brown/tan cells are input fields. For example, enter the start and end years and immediately see the inflation rate between the two years. Enter a price and convert between the start year price and end year price (e.g., from 1900 to 2019 dollars -- or vice versa).


Notes: On some phones you may need to double click to enter data. On some computers, you may have to enter some fields more than once for it to "take." Please leave a comment if you are having problems.

Friday, January 25, 2013

What Will $100 be Worth in 10 - 20 Years?

This post estimates the future value of a dollar for the next 1-50 years, for inflation rates ranging from 1% to 10%. The chart works not just for $100, but for any amount -- $1, $1,000, $10,000, $100,000....  And, it works for 5, 10, 20, 30 ... anything up to 50 years. (This is a companion to a previous post which compares today's dollar to earlier years.)

Inflation is one of the biggest risks that current and future retirees face. Given today's life expectancies, even relatively low rates of inflation can devastate the purchasing power of a pension or uninvested cash during your retirement years. How great could the impact be? See below.

Try my new interactive future inflation impact calculator.  It does the same calculations as the graph below, but for any number of years, and for any inflation rate. Then come back to this post; graphs are still better for seeing the big picture.

What Will $100 be Worth in 5, 10, 20, 30... 50 Years?


What will a dollar be worth 5, 10, 20, 30 years from now in future?
What Will $100 be Worth in N Years?


The Impact of Inflation on the Future Purchasing Power of a Dollar

Over the last 100 years, U.S. inflation has averaged about 3%/year. As you can see from the graph above (click to expand), even at these apparently benign rates (the blue line), within 20 years the purchasing power of a fixed pension will be almost cut in half. Twenty years is not a long retirement these days; most advisors recommend that you plan for thirty. Some retirements last even longer.

Wednesday, February 22, 2012

Why Mutual Fund Owners Earn Lower Returns Than The Funds They Own(!)

Mutual fund owners earn lower returns than their funds report. And, it's not because the funds are lying.

In an earlier post we saw that investors earn significantly less than the theoretical, published overall market returns. In this post we'll see that they also earn less than the published returns for the funds that they actually own! How can that be? Read on.

Mutual Fund Returns vs. Investor Returns (aka Dollar-Weighted Returns)


investor returns, asset-weighted and dollar-weighted returns

The graph above (click to expand) shows that between 1991 and 2010 the return for the average stock fund was 9.9% per year. For this same period, the average stock fund investor earned just

Tuesday, February 14, 2012

The Easiest Way to Increase Investment Returns? Reduce Expenses!

This post highlights the huge impact that just one or two percent in yearly expenses can have on your long-term investment performance. The impact is the same for bonds as it is for stocks.

A previous post discusses expenses that reduce the theoretical, published investment returns -- including taxes, commissions & loads, mutual fund expense ratios, and trading costs. In that post, we saw that these expenses could cut the size of your retirement portfolio in half! Frankly, I was surprised at the magnitude of the impact. How can shaving only one or two percentage points off your annual return have such a huge impact? Read on.

The Impact of an Additional 1% in Annual Return on Investment (ROI)


Impact of expenses on stock and bond market investment returns

The above chart (click to expand) shows

Saturday, October 8, 2011

Real World Expenses Reduce Published Market Returns

The stock market returns published in this blog, and in most other publications, are theoretical returns. In the real world, investors incur expenses that reduce the reported market returns. This post overviews those expenses and shows how they can easily reduce a retirement portfolio to less than 50% of its theoretical value!

Graph shows costs reduce ROI of stock investments

Market or Index Returns

Elsewhere on this site, we have seen that over long periods of time, the DJIA (Dow Jones Industrial Average) has returned about 10% per year. For example, the return from year-end 1990 to year-end 2010 was 10.2%. That was the return earned by the market, as represented by the Dow index, reinvesting all dividends, and ignoring all expenses -- including taxes. Unfortunately, partly because of expenses, those returns do not accurately reflect

Monday, July 11, 2011

What Will My Bond or CD be Worth in 5 Years?

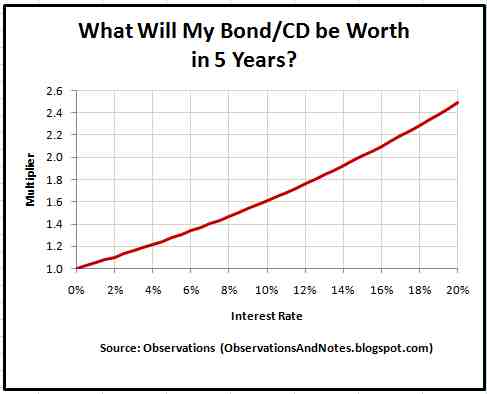
Here's an easy way to approximate what $5,000, $20,000, $50,000, or any other amount will grow to in 5 years. It works for bonds, CDs -- any investment that you expect to compound at a fixed annual rate. You can also use this graph to ballpark the results for multiples of 5 years -- e.g., 10, 15, 20 or 25 years.

NEW! Try my new interactive bond interest calculator. It does the same calculations as the graph below, but for any number of years, and for any interest rate. Then come back to this post; graphs are still better for seeing the big picture.

Because stock market results are not consistent, for stock market results see  the variability of 5-year stock market returns instead.

Approximates Results from the Calculator/Spreadsheet

The interactive bond calculator will give you precise results.  However, since the calculator may not work in some browsers, I'm providing this graph as a way to approximate the results.

What Will my Bond or CD be Worth in 5 Years?


5-year compound growth/ interest rate calculator/estimator for $5,000 $10,000 $15,000

The graph above (click to expand) shows how rapidly a bond or CD of any denomination will grow in five years. Given an interest rate, indicated on the horizontal axis, the "multiplier" on the vertical axis tells you what your investment will be worth in 5 years (assuming earnings reinvested each year, and no taxes). The multiplier is the same regardless of how much money you invest. For example,

Wednesday, June 22, 2011

Why Investing in the Stock Market for Less Than 5 Years is Risky

This post provides justification for the adage that you should not put money into the stock market that you will need in less than 5 years. It is the 5-year version of earlier posts that discussed the distribution of 10 and 20-year stock market returns (see links below).

Some years back, a friend asked me to recommend a good stock investment for her daughter's college fund. Since withdrawals were to start in about three years, my recommendation was not to put the college fund in the stock market at all! Here's why.

What will a $20,000 Stock Market Investment be Worth in 5 Years?


variability & risk of short-term stock market investments

In previous posts, we have looked at the distribution of historical outcomes for typical (but hypothetical) investors investing in the stock market for 10 years and for 20 Years. For those holding periods, the investors virtually always made money -- though sometimes barely so. In approximately 100 sample 10-year periods since 1900, we saw only one instance where the investor's ending portfolio was worth less than his initial investment -- and no instances for 20-year periods.

The above graph (click to expand) is the 5-year version of the earlier charts. It shows the historical results of

Friday, May 13, 2011

What Would $10,000 in 19xx be Equivalent to Today?

Want to approximate what $1 in 1900 or 1929 or 1985 (or any other year) would be equivalent to today? How about what $100 or $1,000 today is equal to in past years? The graphs below will help you convert amounts in current 2012 dollars to amounts with the same buying/purchasing power in any prior year (beginning in 1900); you can also use it in the reverse direction. To see what today's dollar will be worth in the future, see What Will $100 be Worth 10 - 20 Years From Now?

NEW! Try my new interactive inflation calculator.  It does the same conversions as the graphs below, but you can convert from any year to any other year. Then come back to here; the graphs are still better for seeing the big picture.

I originally designed The Observations Inflation Spreadsheet to answer questions like the above, along with many other questions related to inflation and the impact of inflation on the dollar's purchasing power. The graphs below allow those without spreadsheets to approximate some of the spreadsheet's results.

What Was a Dollar in 19xx Worth vs. Today? e.g., What Was $10,000 in 1900 Equivalent to in 2012?


convert prior years dollar purchasing power to current 2012 dollars

The graph above (click to expand) converts dollar values from past years into their equivalent in today's dollars. For example,

Wednesday, April 27, 2011

What Will $10,000 be Worth in 10 Years? (CDs, Bonds, Dollars...)

Here's an easy way to approximate what $10,000, or $100,000, or any other amount will be worth in 10 years. It works for bonds, CDs -- any investment that you expect to compound at a constant annual rate. You can even use it to ballpark the results for 20, 30, 40 or 50 years. (Note: to estimate returns for 5 years, and multiples of 5 years, see What Will my Bond or CD be Worth in 5 Years?.) In all cases, you supply the interest rate, and read the multiplier off the chart.

NEW! Try my new interactive bond interest calculator. It does the same calculations as the graph below, but for any number of years, and for any interest rate. Then come back to this post; graphs are still better for seeing the big picture.

For the future value a dollar, see What Will $100 be Worth in 10 - 20 Years? Finally, because stock market results are not consistent, for stock market results see What Will a $10,000 Stock Market Investment be Worth in 10 Years? instead.

Approximates Results From the Calculator

The interactive bond calculator will give you more accurate results. However, since the calculator may not work for all browsers, I'm providing this graph as a way to approximate the results.

What Will a $10,000 Bond/CD be Worth in 10 Years?


10 year compound growth/ interest rate calculator/estimator
Note: the multipliers (on the vertical axis) range from 1 to 10. The bottom (labelled) line corresponds to a multiplier of 1, the next (unlabelled) line to a multiplier of 2, etc. The lines are not the same distance apart because the vertical axis uses a log rather than linear scale (see about log graphs).

What Will a $10,000 Bond/CD be Worth in 10 Years at 10%?

In the graph above (click to expand), find 10% on the horizontal axis. The multiplier looks to be about 2 2/3 (it's actually 2.6). So, $10,000 at 10% for 10 years is approximately ($10,000 x 2.6=) $26,000.  The multiplier is the same regardless of how much money is invested. This same multiplier works for $1,000, $100,000, or $364.27.

Thursday, April 21, 2011

The Decrease in Purchasing Power of the U.S. Dollar Since 1900

(Last updated November, 2020)
The declining value of the dollar is one of the biggest threats to retirees, and near retirees. This post explores the history of that decline over the past 100 years or so, with graphs going back to 1900.

One of the biggest threats to my own retirement plan is the cumulative impact that future inflation rates will have. Readers whose retirement income is not cost-of-living-adjusted need to evaluate the impact that inflation and the declining value of the dollar will have on their income, and be prepared to supplement their income as necessary.

Try my interactive inflation calculator that will convert any prior year dollars to any later year  right on your screen.  Then come back to this post and look at the bigger picture.

Decreasing Purchasing Power of the U.S. Dollar: What's $10,000 in 1900 Worth Today?


100 years of inflation history: declining value of the dollar. to 2020

The graph above (click to expand) shows that if a shopper were magically transported from the year 1900 to 2020, the $100 bill that he had in his wallet in 1900 would now be worth only $3.06! That is, $100 in 2020 would have the purchasing power that $3.06 had in 1900; $10,000 would be worth only $306 today. That's a 96.9% decrease in buying power. Our shopper would consider current dollars virtually worthless. (Note: the calculations in the post were made using my inflation calculator.)

The Cumulative Impact of Inflation on Retirement Planning

Since 1900, U.S inflation has averaged about 3.0% per year. However, even at that moderate rate, the cumulative effect is

Tuesday, April 12, 2011

The Observations Inflation Calculator/Spreadsheet

Last updated Sept 2020
This spreadsheet:
  • calculates the inflation rate between any two years between 1900 and 2020
  • converts dollar values from one year to another using the CPI (Consumer Price Index)
  • calculates the change in the purchasing power of a dollar
  • and more.
NEW! Try my new interactive calculator. It does all of the above right on your screen. The spreadsheet below is not interactive, but contains additional capabilities not included in the calculator.

Note:  If you don't have spreadsheet software, see the following easy-to-use graphs: What Would $10,000 in 19xx be Equivalent to Today? What Will $100 be Worth in 10-20 Years?, and "Related Materials" at the end of this post.

The Observations Inflation Calculator/Spreadsheet

Note: Click on the screenshot below to expand it. The link to download the spreadsheet is at the end of the post.

using CPI data to calculate purchasing power and value of a dollar in 2012
The Observations Inflation Calculator/Spreadsheet

What is that in today's dollars?

That's a question my readers sometimes ask -- especially when I'm reporting financial data from long before they were born. Since intuition is often useless when comparing dollar amounts from different eras, I've developed a calculator/spreadsheet to help.

The spreadsheet above can help answer questions such as:
  • My parents' house cost $50,000 in 1970. What would that be in today's dollars?
  • My current salary is $40,000/year. What was the equivalent 1985 salary?
  • What was the inflation rate between 1929 and 1935?
  • What will $100,000 be worth in 20 years?
  • What rate of return do I need to grow $10,000 into $30,000 in 10 years?

Tuesday, March 15, 2011

100 Years of Inflation Rate History

Inflation can be devastating; while it has been under control for the past 25 years, there is no guarantee that it will remain so. Since this blog emphasizes long-term planning, it is important that we address the issue of inflation, and the impact that the declining purchasing power of the dollar has on our investments. For perspective, as always, let's first look at the past century.

U.S. Inflation Rates since 1900

Yearly change in consumer price index (CPI-U) 1900-2012
U.S. Yearly Inflation since 1900

The above chart shows the yearly rate of inflation as measured by the Consumer Price Index for All Urban Consumers (CPI-U) for the past 100 years. By early 2012, prices were more than 28 times higher than in 1900 -- the CPI increased from 7.9 to 226.7. Phrased differently, a dollar buys 28 times less now than a dollar bought in 1900 (see inflation calculator). While inflation has averaged only 3% for the complete period, and also 3% since 1982, such subdued inflation has clearly not always been the case. The graph shows several periods where inflation rose to 10% or more. Here's a quick summary of inflation's impact on some key areas.

The Impact of Inflation: A Dollar Buys a Lot Less Than it Used To

Inflation increases the

Tuesday, February 8, 2011

The Importance of Avoiding Large Stock Market Losses

During the 2008-2009 stock market crash, the DJIA (Dow Jones Industrial Average) fell 54% - to a low close of 6547 on March 9, 2009. In a February, 2011 post , I observed that since that low the market was up over 80%. Yet, it was still more than 15%, and more than 2000 points, below the all-time high of 14,164! How can a 54% loss be more than an 80% gain? Read on....

Gains Needed to Offset Stock Market Losses


impact of stock market losses -- how large losses wipe out much larger gains

The Impact of Large Stock Market Losses

The above chart (click to expand) shows the gain required to offset losses from 0% to 90%. I wanted to go even beyond a 90% loss, but if you want to see what happens beyond that,

Monday, October 4, 2010

The Importance of Bond Duration

Duration is a way to measure interest rate risk; it is a more precise measure than maturity alone.

The Impact of Duration on Sensitivity to Rate Changes


The graph above demonstrates the impact that duration has on the sensitivity of bond prices to interest rate changes. This post explains how duration is calculated and

Thursday, September 23, 2010

Yield to Maturity (YTM) & Interest Rate Risk

This post introduces YTM, and explains why rising interest rates result in falling bond prices.


Bond Price and YTM/Interest Rates

The above graph summarizes the relationship between the two; the post helps explain why this is so.


Calculating a Bond's Yield to Maturity
In the fundamentals of investment valuation post, we introduced the concept of present value, and arrived at

Tuesday, August 24, 2010

Fundamentals of Investment Valuation

As we saw in Bond Basics, a bond typically represents an obligation by the borrower to pay fixed amounts of interest on fixed dates, and to repay the principal amount when the bond matures. The relative certainty of the amounts and dates is the major advantage of bonds compared to other possible investments. Bond valuation, then, is assigning a value or price to this stream of payments.

Intro to Present Value: What is $105 a Year from Now Worth to You Now?

The key to pricing bonds is the concept of Present Value, or PV. Suppose you can earn 5% interest and you have $100. From the bond basics post we know that interest = principal x rate x time. So, in one year $100 will earn ($100 x 5% x 1 =) $5 in interest.

Therefore, a year from now you can have $105 -- your original $100, plus $5 in interest. It is in that sense that the "present value" of $105 a year from now is said to be $100; $105 a year from now is worth $100 today. Note that the

Monday, July 26, 2010

Bond Basics

What Is a Bond?

A bond is a loan. When you buy a bond, you are lending money to the bond's issuer. Generally, the loan is for a fixed amount of money, the principal -- or face amount -- for a fixed length of time. At the end of that time, the bond is mature; the borrower pays off the loan by paying off the face amount. Most often, the loan is at a fixed rate of interest, the interest being due on a fixed schedule during the life of the loan (e.g., quarterly or yearly).

Technically, not all fixed income instruments are bonds. However, in this post I am using the term bond loosely to include not just bonds, but other fixed income instruments such as bills, notes and certificates of deposit as well.

Basic Bond Math: Calculating Interest

Saturday, January 30, 2010

Investing: Subject Index

TABLE OF CONTENTS


INVESTING-GENERAL, BONDS & INFLATION


Inflation

The Declining Value of a Dollar: 100 Year History: Shows the dramatic decrease in purchasing power over time.
Inflation Calculator: Calculates inflation rate between any two years. Converts current dollars to/from prior years.
What Would $10,000 in 19xx be Equivalent to Today? graph to convert dollar amounts from any prior year to their approximate equivalent today.
How Much Will $100 be Worth in 10-20 Years? converts today's dollars to equivalent in future years.
100 Years of Inflation History: graph, + summary of impact of inflation on bonds, stocks, housing....
Inflation Calculator/Spreadsheet: calculates inflation rate and change in purchasing power between any two years -- e.g., between 1970 & 1980.

Friday, August 28, 2009

Retirement Planning: Start to Invest When You're Young

Is it really important that you start to plan for your retirement early in your career? Does it really make that much difference? Starting a saving and investing program when you're young is likely more important than you think. Take a look at the charts below.

Starting to Save & Invest for Retirement at Age 25 vs. 35 vs. 45


Start saving for retirement when young: compound interest

The solid blue line above shows the results for a hypothetical investor who begins saving and investing $3,600/year at age 25. If that investor earns 8% per year, at age 65 he will have about $1 million (that's actually why I picked $3600). Readers will not be surprised to see that the hypothetical investor who starts investing at age 25 has more money at age 65 than the investors who start at age 35 and 45. However, many readers will be surprised once they fully