NEW! Try my new interactive inflation calculator. It does the same conversions as the graphs below, but you can convert from any year to any other year. Then come back to here; the graphs are still better for seeing the big picture.
I originally designed The Observations Inflation Spreadsheet to answer questions like the above, along with many other questions related to inflation and the impact of inflation on the dollar's purchasing power. The graphs below allow those without spreadsheets to approximate some of the spreadsheet's results.
What Was a Dollar in 19xx Worth vs. Today? e.g., What Was $10,000 in 1900 Equivalent to in 2012?
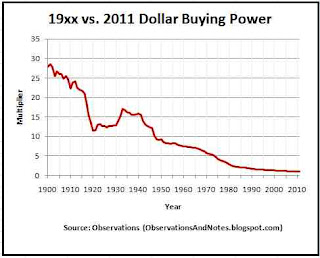
The graph above (click to expand) converts dollar values from past years into their equivalent in today's dollars. For example,
the "multiplier" (read on the vertical axis) for 1900 is about 29. That means that a dollar in 1900 would buy about 29 times as much as a dollar buys in 2012. It follows that $10,000 in 1900 was roughly equal to ($10,000 x 29=) $290,000 today.
Similarly, the multiplier for 1929 is about 13. Thus, for example, $100,000 in 1929 was equivalent to ($100,000 x 13=) $1,300,000 in 2012.
What's $10,000 in Today's Dollars Equal to in 1900 Dollars?
To go in the other direction, we divide instead of multiply. So, $10,000 in 2012 is equivalent in buying power to ($10,000 / 29=) $345 in 1900. And, $100,000 now is worth about the same as ($100,000 / 13=) $7690 was worth in 1929.What Was $100,000 in 1980 Equivalent to in 2012? -- Log version
The above graph is the same as the top graph except I've changed the scale on the vertical axis from linear to log. (If you're not familiar with these, see About Log Graphs). Note that the horizontal gridlines between 1 and 10 are in increments of 1; above that point, they are in increments of 10 -- so, the very top gridline represents a multiplier of 30.
The advantage of the log scale in this case is that we have much greater visibility, and can make much more accurate chart readings, in the recent years. For example, using the top chart you might estimate the multiplier for 1980 at about 2.5. Using the above chart, you can clearly see that it's much closer to 3 (it's actually 2.9). So, $100,000 in 1980 is equivalent to ($100,000 x 2.9=) $290,000 now. And, $10,000 in 2012 has about the same purchasing power as ($10,000 / 2.9=) $3448 in 1980.
Best for Questions like: What is My $100,000 Salary Equivalent to in 1985? or What is a $50,000 Investment Portfolio in 1985 Equivalent to in 2012?
Remember, the CPI (consumer price index) measures changes in general price levels. As a result, it's best used to compare the purchasing power of income or assets rather than to estimate the price of a specific item such as a car. A quick look at the graph shows that the multiplier for 1985 is around 2; that means prices now are about twice what they were in 1985. It follows that $50,000 in assets or income in 1985 had roughly the same buying power that $100,000 in assets or income has today.Years like 1932, 1939, 1965, 1974 & 1987 may be of special interest to stock market investors. If you're looking "just for fun," take a look at even years like 1920, 1950, 1960, 1990....
What Will $10,000 Be Worth in the Future?
See the companion post: What Will $100 be Worth 10 - 20 Years From Now?Comparison to the Decline in Value/Worth of a Dollar Chart
The careful observer will notice that the top graph is very similar to the top graph in the Declining Value of the U.S. Dollar post. That's because we're looking at the same series of CPI data points -- just from two different points of view. In "declining value" we were looking at CPI data using 1900 as our reference -- our benchmark. Thus, for example, the 1900 index was $100, and the 2012 value was $3.48. In this post, we're using 2012 as our reference. So, 2012 is 1, and 1900 is 28.7. However, from either point of view, the shape of the curve is the same.Related Posts
The Declining Value of the U.S. Dollar: Tracks the decline in value since 1900What Will $100 be Worth 10 -20 From Now? Compares today's dollar to future dollars.
100 Years of U.S. Inflation Rate History: graph of yearly inflation since 1900, with discussion.
The Observations Inflation Spreadsheet the spreadsheet I used for these calculations.
What Will my $N,000 Bond/CD be Worth in 10 Years? uses a similar approach, & is very helpful if you don't have spreadsheet software.
What Would $1 Invested in the Stock Market in 19xx be Worth Now? What if the money had been invested in the stock market.
For lists of other popular posts and an index of stock market posts, by subject area, see the sidebar to the left or the blog header at the top of the page.
Data Sources
Pre-1913: Robert Shiller "Irrational Exuberance" data
1913 forward: Consumer Price Index for All Urban Consumers: All Items (CPI-U) from the U.S. Department of Labor: Bureau of Labor Statistics.
Copyright © 2011. Last modified: 3/9/2013
Share This Article
Archives:


No comments:
Post a Comment
No spam, please! Comment spam will not be published. See comment guidelines here.
Sorry, but I can no longer accept anonymous comments. They're 99% spam.