Blocks per 40 Minutes of Playing Time
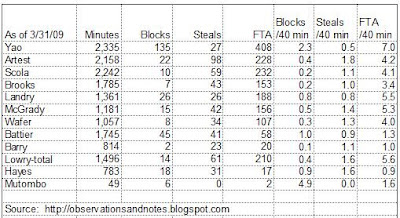
The top 3 are Dikembe Mutombo (4.9 blocks per 40 minutes of playing time), Yao Ming (2.3), and Shane Battier (1.0). Deke leading the way is, of course, no surprise; he's one of the best shot-blockers in the history of the game. However, his 4.9 is probably artificially high because he played so few minutes; the prior two years, he was right around 3.
The surprise here, for some anyway, is Shane -- and this was an off year for him. My sense is that it took him more than half the season to fully recover from his off-season surgery; otherwise, his number might have been closer to the 1.4 he had last year. Another surprise, for some, is the under-appreciated Chuck Hayes, with 0.9. Landry was close behind with 0.8 -- a big increase over last year's 0.4.
Steals per 40 Minutes of Playing Time
The top 3 are Ron Artest (1.8 steals per 40 minutes of playing time), followed by Chuck Hayes and Kyle Lowry (tied at 1.4). No one should be surprised to see Artest in first place. But, here's the "Chuck Wagon" again excelling at defense -- in this case, because he has quick hands. Note: I'm trying to get a good read on Lowry's game, so I'm using his full season totals -- i.e., I'm including his games with Memphis.
Free Throw Attempts per 40 Minutes of Playing Time
The top 3 are Yao Ming (7.0 free throw attempts per 40 minutes of playing time), Kyle Lowry (5.6), and Carl Landry (5.5). I wouldn't have been surprised if Yao's number was higher. In fact, you could argue it should have been higher. For reference, take a look at Shaq (9.2) and Dwight Howard (12.0)!
I'm using free throw attempts to approximate the number I'd really like to see -- fouls drawn. (If anyone knows where I can get fouls drawn please let me know.) It's an under-reported and under-appreciated stat. Drawing fouls is important not only because you get free throws (sometimes), but also because:
- You get the opposing team closer to its limit for the quarter -- so, you're increasing the number of foul shots, and points, your team will get later in the game.
- You get the opposing player closer to his limit for the game. If he's a starter, and he fouls out, he'll be replaced by a less accomplished player -- which generally means fewer points for the opposition, or more points for your team, or both. More likely, he won't foul out. However, you've still increased the probability that you will be able to get that player in foul trouble and force his coach to play him fewer minutes. Again, a less accomplished player will replace him. Finally, you've increased the probability that, in order to avoid another foul, he'll play less aggressive defense -- which increases the probability that your team will score. It's most obvious when you see a good shot blocker not even attempt to block a shot because he can't afford to take the chance of another foul.
Rockets fans have seen the impact of fouls demonstrated many times -- especially in Yao's early years. How many times have we lost a game because foul trouble limited Yao's minutes?
One of the reasons I'm so fond of Kyle Lowry is because of his ability to draw fouls. Don't misunderstand, I'm a big "AB" fan as well -- he and Kyle are just very different point guards. Having both may well turn out to be a significant plus for the Rockets during this year's NBA playoffs. This is another example of the depth and flexibility that the GM, Daryl Morey, is building into this team, as I mentioned in my season kickoff post. Tracking free throw attempts allows you to "guesstimate" how many fouls a player draws on the offensive end -- but not on the defensive end. Looking only at free throw attempts, Shane Battier and Chuck Hayes come in 10th and 12th on the team. That obviously significantly underestimates the contribution that those two make drawing fouls.
I'll try to do at least one more post in this series in the next couple of weeks -- as long as the Rockets are still playing....
For more detail on the above stats, see below.
Houston Rockets 2008-2009 Production per 40 Minutes Played
The table below (click to enlarge) shows the Rockets' results per 40 minutes of playing time for blocks, steals, and free throw attempts. For example, I divide a player's total blocks by his number of minutes played to get blocks per minute, and multiply that result by 40 to approximate his results for a full game (players rarely play a full 48 minutes). Note: I've omitted Brian Cook, Joey Dorsey and James White; they didn't play enough minutes to yield reliable results.
Houston Rockets "Per Minute" Statistics 
Related Material:
Houston Rockets "Per-Minute" StatisticsHouston Rockets: Is it Time Yet?
Houston Rockets "Total" Production Per-Minute
The source of my data is NBA.COM
Last modified 3/12/2010
No comments:
Post a Comment
No spam, please! Comment spam will not be published. See comment guidelines here.
Sorry, but I can no longer accept anonymous comments. They're 99% spam.