Retirement Expense Graph
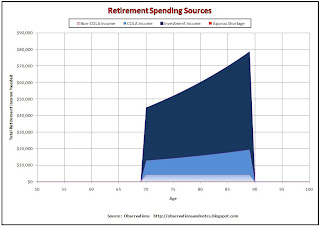
The graph above (click to expand) shows the retirement spending and income plan for a hypothetical 70 year-old, Pat, who retired at age 65 and plans to live in retirement for another 20 years. The light blue section of the graph represents her pension of $5,000/year (shown as $4,250 after tax). The pension does not contain a cost of living adjustment (COLA) provision; it will remain $5,000/year for the duration of Pat's retirement. The medium blue section represents income that does include a COLA, social security. The assumption is that Pat's social security income is now $10,000/year before tax, and will increase annually with inflation.
The dark blue section represents additional income required from investments in order to cover Pat's total expected after tax retirement expenses of $45,000/year in today's dollars. Note that total expenses are expected to increase 3% per year because of inflation.
Since there is no red section in this graph (representing a shortage), this plan is "working." However, that does not mean that Pat is home free. I would not be comfortable were I in Pat's position.
Concerns About Pat's Plan
I have at least two concerns about this plan.- This plan assumes the vast majority of Pat's retirement assets are invested in the stock market. As we have seen in previous posts, stock market returns are notoriously variable even over periods as long as 20 years. That means Pat's income from investments could be significantly less than planned.
- A related concern is that a relatively small percentage of Pat's income is guaranteed.
In a future post, we'll look at an alternative for making Pat's retirement income more reliable.
Link to Spreadsheet
Here's the link to download Al's Simple Retirement Planning Model (version 4). If you have any problems accessing or using the model, see this post.Related Posts
A Retirement Planning Calculator/Spreadsheet The first post in this retirement series.Implications of Dollar Returns on Retirement Planning: Looking at market returns in dollars rather than percentages produces some surprising insights.
Don't Plan Retirement Assuming Average Stock Market Returns
The Declining Value of a Dollar: Inflation is an important threat to retirees.
For lists of other popular posts, see the sidebar to the left or see the subject index in the blog header.
This work is licensed under a Creative Commons Attribution 3.0 unported license.
Last modified: 4/22/2011
Share This Article
To share via Facebook, Twitter, etc., see below.

MS Excel reports "File Corrupt" when trying to open spreadsheet.
ReplyDeleteCan you try that again? I just downloaded with no problems.
DeleteReally great post, Thank you for sharing This knowledge.Excellently written article, if only all bloggers offered the same level of content as you, the internet would be a much better place. Please keep it up! financial advisor columbia sc
ReplyDelete