Wednesday, April 27, 2011

What Will $10,000 be Worth in 10 Years? (CDs, Bonds, Dollars...)

Here's an easy way to approximate what $10,000, or $100,000, or any other amount will be worth in 10 years. It works for bonds, CDs -- any investment that you expect to compound at a constant annual rate. You can even use it to ballpark the results for 20, 30, 40 or 50 years. (Note: to estimate returns for 5 years, and multiples of 5 years, see What Will my Bond or CD be Worth in 5 Years?.) In all cases, you supply the interest rate, and read the multiplier off the chart.

NEW! Try my new interactive bond interest calculator. It does the same calculations as the graph below, but for any number of years, and for any interest rate. Then come back to this post; graphs are still better for seeing the big picture.

For the future value a dollar, see What Will $100 be Worth in 10 - 20 Years? Finally, because stock market results are not consistent, for stock market results see What Will a $10,000 Stock Market Investment be Worth in 10 Years? instead.

Approximates Results From the Calculator

The interactive bond calculator will give you more accurate results. However, since the calculator may not work for all browsers, I'm providing this graph as a way to approximate the results.

What Will a $10,000 Bond/CD be Worth in 10 Years?


10 year compound growth/ interest rate calculator/estimator
Note: the multipliers (on the vertical axis) range from 1 to 10. The bottom (labelled) line corresponds to a multiplier of 1, the next (unlabelled) line to a multiplier of 2, etc. The lines are not the same distance apart because the vertical axis uses a log rather than linear scale (see about log graphs).

What Will a $10,000 Bond/CD be Worth in 10 Years at 10%?

In the graph above (click to expand), find 10% on the horizontal axis. The multiplier looks to be about 2 2/3 (it's actually 2.6). So, $10,000 at 10% for 10 years is approximately ($10,000 x 2.6=) $26,000.  The multiplier is the same regardless of how much money is invested. This same multiplier works for $1,000, $100,000, or $364.27.

Thursday, April 21, 2011

The Decrease in Purchasing Power of the U.S. Dollar Since 1900

(Last updated November, 2020)
The declining value of the dollar is one of the biggest threats to retirees, and near retirees. This post explores the history of that decline over the past 100 years or so, with graphs going back to 1900.

One of the biggest threats to my own retirement plan is the cumulative impact that future inflation rates will have. Readers whose retirement income is not cost-of-living-adjusted need to evaluate the impact that inflation and the declining value of the dollar will have on their income, and be prepared to supplement their income as necessary.

Try my interactive inflation calculator that will convert any prior year dollars to any later year  right on your screen.  Then come back to this post and look at the bigger picture.

Decreasing Purchasing Power of the U.S. Dollar: What's $10,000 in 1900 Worth Today?


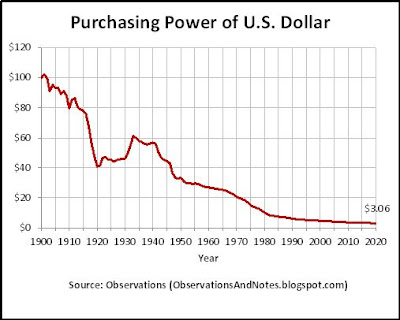
100 years of inflation history: declining value of the dollar. to 2020

The graph above (click to expand) shows that if a shopper were magically transported from the year 1900 to 2020, the $100 bill that he had in his wallet in 1900 would now be worth only $3.06! That is, $100 in 2020 would have the purchasing power that $3.06 had in 1900; $10,000 would be worth only $306 today. That's a 96.9% decrease in buying power. Our shopper would consider current dollars virtually worthless. (Note: the calculations in the post were made using my inflation calculator.)

The Cumulative Impact of Inflation on Retirement Planning

Since 1900, U.S inflation has averaged about 3.0% per year. However, even at that moderate rate, the cumulative effect is

Tuesday, April 12, 2011

The Observations Inflation Calculator/Spreadsheet

Last updated Sept 2020
This spreadsheet:
  • calculates the inflation rate between any two years between 1900 and 2020
  • converts dollar values from one year to another using the CPI (Consumer Price Index)
  • calculates the change in the purchasing power of a dollar
  • and more.
NEW! Try my new interactive calculator. It does all of the above right on your screen. The spreadsheet below is not interactive, but contains additional capabilities not included in the calculator.

Note:  If you don't have spreadsheet software, see the following easy-to-use graphs: What Would $10,000 in 19xx be Equivalent to Today? What Will $100 be Worth in 10-20 Years?, and "Related Materials" at the end of this post.

The Observations Inflation Calculator/Spreadsheet

Note: Click on the screenshot below to expand it. The link to download the spreadsheet is at the end of the post.

using CPI data to calculate purchasing power and value of a dollar in 2012
The Observations Inflation Calculator/Spreadsheet

What is that in today's dollars?

That's a question my readers sometimes ask -- especially when I'm reporting financial data from long before they were born. Since intuition is often useless when comparing dollar amounts from different eras, I've developed a calculator/spreadsheet to help.

The spreadsheet above can help answer questions such as:
  • My parents' house cost $50,000 in 1970. What would that be in today's dollars?
  • My current salary is $40,000/year. What was the equivalent 1985 salary?
  • What was the inflation rate between 1929 and 1935?
  • What will $100,000 be worth in 20 years?
  • What rate of return do I need to grow $10,000 into $30,000 in 10 years?

Sunday, April 3, 2011

Navigation Instructions Using the Graphical Navigator

In my continuing effort to make Observations easier to navigate, I'm trying out a new navigation tool. It looks like this


You can access it by clicking on the image above, or the similar image located in the sidebar on the left.

Note: These views require modern browsers such as Internet Explorer 8+, Firefox 3.5+, Chrome or Safari -- else, will just take you back to the Home page.

Basic Navigation in the Snapshot View

Once you click on the image you will see:
  • a snapshot from each Observations post, with the first 30 characters of the title -- similar to 12 snapshots in the image above, but larger.
  • Mouse over any snapshot and you will see a short snippet from the post -- the first sentence or two.
  • Click on a snapshot and you will be taken to the post. You will get the "short feed" for the post -- the first 200 words or so. (Note: You can navigate through the short feeds by using your <- and -> keys, or clicking on "older" or "newer" at the top of the page. "Back to all Posts" takes you back to the initial view.)
  • To see the full post, click on the post title, or click on Read More at the end of the short feed.

Friday, April 1, 2011

March 2011 Stock Market Update


March, Year-To-Date & Recovery-To-Date Review
Note: Click here for April 2011 stock market results

For the first time in months, the stock market did not set a multi-year high. The pullback that started last month amid concerns about unrest in the Middle East, and the resulting increase in oil prices, continued as the disturbances spread and escalated -- even to the point of U.S. (limited) military involvement.

Fukushima-Daiichi Nuclear Plant Incident

In addition, one of the largest earthquakes in recent memory (9.0 on the Richter scale) struck Japan. The earthquake caused not only major damage and scores of aftershocks, but still another tsunami. The combination of the earthquakes and the tsunami caused widespread devastation in Japan; one result was enough damage to the Fukushima nuclear power plant to ultimately cause radiation leakage and raise the possibility of a nuclear meltdown. It also raised the possibility of worldwide supply disruptions, especially in the automotive and electronics industries, in a global economy supplied by "just-in-time" (JIT) inventories.
(Note: for explanations of what happened in the Fukushima-Daiichi nuclear plant incident, see Anatomy of a Nuclear Crisis: A Chronology of Fukushima or this excellent PowerPoint presentation by Areva.)

Not surprisingly, the market "hiccupped" -- falling as low as