Cyclical Stock Market Returns
In the most recent stock market post, we looked at 10 Year Rolling Returns vs. the normalized P/E Ratio in an attempt to discover what was causing the very regular stock market cycles that we first observed in the 10 Year Rolling Returns post. The graph provided clear visual evidence of both the the cyclicality of (normalized) P/E ratios and the impact of those ratios on future returns. More specifically, it was clear that, as a general rule, investors who bought when the normalized P/E ratio was high experienced low 10-year returns; on the other hand, investors who bought when the normalized P/E ratio was low experienced high 10-year returns. (If you are not familiar with normalized earnings and P/E Ratios, see this post for a more detailed discussion.)
Stock Market Earnings
I think over the long run earnings are a more important determinant of stock market performance than price/earnings ratios. Therefore, it seemed reasonable to ask to what extent, if any, earnings contributed to the cyclicality that we observed in returns.
Over the long run, earnings can continue to go up indefinitely -- the P/E ratio cannot. The second chart in the Dow P/E Ratios since 1929 post shows that while the normalized P/E ratio has gone up and down, normalized earnings appear to have gone steadily upward. It turns out, that chart is somewhat misleading -- to me anyway. The increase in normalized earnings is not as steady as it appears in that chart.
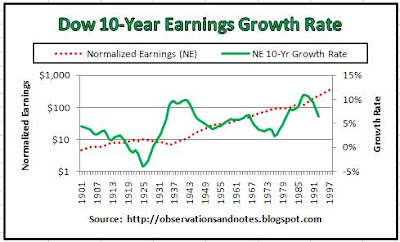
Dow 10-Year Normalized Earnings Growth Rate

In the above chart (click to enlarge) the dotted line shows the same normalized earnings (NE) as in the P/E Ratios since 1929 post, again using a log scale. (For a discussion of log scale, see this post.) In addition, I've added a solid line showing the normalized earnings 10-year annualized growth rate. Each point on the line plots the growth rate of NE over the following 10 years. For example, the last point on the line is 1993, with a value of approximately 6.4%. That 6.4% represents the annual percent increase in Dow normalized earnings from $237 in 1993 to $443 10 years later.
Now we can see that there is ebb and flow to the NE growth rate; it increases sharply for a while, then tends to drift downward. As a result, earnings are another potential source of the cyclicality that we observed in rolling 10-year stock market returns.
Dow 10-Year Earnings Growth Rate vs Returns

In the chart above (click to expand), the 10-year growth in normalized earnings is plotted against the 10-year growth in the stock market. Coincidentally, both series peak in 1988. The 10-year normalized earnings growth rate peaks at 10.9%, and the 10-year stock market annual return peaks at 18.6%. However, that is the only year where the peaks correspond. For some periods, increasing earnings growth seems to precede increasing stock market returns; in other periods, the sequence is reversed. In short, the relationship between 10-year earnings growth rate and 10-year returns is not as clear cut as I hoped it would be. I guess I would call it "suggestive" -- but you can draw your own conclusion.
Bottom line: For now, I think the clearest "view" of the impact of earnings on returns is still through the Historical Analysis tab of my Stock Market Analysis Model.
Update: Also see Earnings & Dividends Determine Long-Term Stock Market Returns.
Other Related Posts:
Rolling Returns vs. P/E RatioFor a list of all stock market posts, by subject area, click here.
Last modified: 4/10/2011
This work is licensed under a Creative Commons Attribution 3.0 unported license.
No comments:
Post a Comment
No spam, please! Comment spam will not be published. See comment guidelines here.
Sorry, but I can no longer accept anonymous comments. They're 99% spam.