Saturday, December 22, 2012

How Much Money Will You Need to Retire?

**Note: There is a newer version of this post here. **

This post uses the 4% withdrawal approach to calculate savings needed to retire at age 65 for those who earn from $10,000 to $250,000 or more and will be eligible to receive full, or nearly-full, Social Security benefits.

Previous posts established retirement savings benchmarks/targets from age 25 to 65 for a typical average income worker and a typical high-income worker. This post only calculates the target at age 65, and, as a result, is appropriate for all salary levels.


How Much Will You Need to Retire?


Retirement savings needed on retirement date at age 65
How Much Money Will You Need to Retire?


With an Average Salary, You'll Need Around 9 Times Your Salary to Retire

If you follow the 4% withdrawal guidelines, it's easy to calculate how much money you will need in order to retire at age 65. Basically, you will need (100%/4%=) 25 times the amount you expect to withdraw from your savings in your first year of retirement. To facilitate the computation, I have assumed that your total yearly spending in retirement will equal 75% of your current salary, adjusted for inflation.

However,

Saturday, December 15, 2012

How Much Should You Have in Retirement Savings? - average incomes

This post uses the "4% withdrawal" approach to retirement savings to estimate how much most people should have in savings -- by age.  And, given how much you actually have, what percent you should save going forward.

This post is designed for those earning approximately $40,000/year who are eligible for Social Security. Earn more? See higher income, or not eligible for Social Security.

Retirement Savings Targets for Those Eligible for Social Security


How much need in savings age 35, 40, 50, 60. 5-30 years before retirement
Retirement Savings Targets, by age


Have I saved enough for my retirement? Am I on track? Here's an easy-to-use graph to help those with earnings around $40,000/year plan for retirement. An earlier post calculated the percent of your salary you should save each year, depending upon when you start your retirement savings plan. This one provides some benchmarks to monitor your progress along the way.

Sunday, December 9, 2012

How Much Should You Have in Retirement Savings? - higher incomes

This post uses the "4% withdrawal" approach to retirement savings to estimate how much high-income earners should have in savings -- by age.  And, given how much you actually have, what percent you should save going forward.

Those With Higher-Salaries Need to Save More Than The Average

Have I saved enough for my retirement? Am I on track? Here's an easy-to-use graph to help those earning $100,000 or more plan for retirement; they need to save more than the average. An earlier post calculated the percent of salary that high-income earners should save each year, depending upon when they start their retirement savings plan. This one provides some benchmarks to monitor your progress along the way.

Retirement Savings Targets for Those With Higher Salaries


How much should I have in retirement savings at age 30, 35, 40, 45, 50, 55, 60 ...
Retirement Savings Targets for Higher Salaries

This post is designed for those earning $100k or more who are eligible for Social Security. Earn more? See targets for those not eligible for Social Security. Earn less? See typical Social Security recipients. Ending targets for all salary levels are covered in How Much Will You Need to Retire?

Thursday, December 6, 2012

Personal Strategic Planning Development - Optional tasks


Following are some additional thoughts relevant to developing your personal strategic plan. For the most part, these address special situations, or are optional enhancements to Creating Your Personal Strategic Plan.


Create SMART Goals and Strategies

Make your goals and strategies SMART: Stretching (challenging), Measurable (so that you know whether or not they have been achieved), Achievable, Relevant, and Time-bound (i.e., set target dates/deadlines). (Note: There are many variations of what SMART means, but all are similar. See, e.g., Wikipedia).

Avoid Analysis Paralysis

Monday, December 3, 2012

Personal Strategic Planning Schematic


index to personal strategic planning posts
Personal Strategic Planning Schematic


Intros/Overviews

Do You Need a Personal Strategic Plan? A process for establishing life priorities
A Personal Strategic Plan Example: An introduction to & overview of the planning process, including examples and sample formats.

Sunday, November 25, 2012

Assumptions for the "4% Withdrawal Rate" Retirement Savings Graphs

Retirement planning: retire safely & comfortably using 4% initial withdrawal rate
The Observations posts based upon the Trinity Study / "4% Withdrawal Rate" guidelines for retirement savings include a short version of the assumptions made. This post discusses the assumptions underlying those graphs in more detail.  (See Related Materials below for a list of the posts.)

The Trinity Study (The "4% Withdrawal Rate" Approach to Determining Retirement Savings Needs)

The Trinity Study was a retirement study conducted by three finance professors from Trinity University. They assumed that, given today's lifespans, a safe retirement portfolio should be large enough to last for thirty years. Their methodology involved simulating the performance of a variety of stock/bond allocations using actual historical market performance data. Their research concluded that the most important factor in having retirement savings last that long was a realistic initial withdrawal rate. Further, they found that for a wide range of portfolios, a portfolio would have lasted 30 years more than 90% of the time if you started with a 4% initial withdrawal rate.

Thursday, November 22, 2012

How Much Should You Have in Retirement Savings? (by age)

In this post, we use the "4% withdrawal" approach to retirement planning to approximate how much you should have in savings at each age. And, given how much you actually have, what percent you should save going forward.

Have You Saved Enough for Your Retirement?

Have I saved enough for my retirement? Am I on track? These are critical questions for those hoping to retire in comfort. In the previous series, we calculated the percent of your salary that you should save each year. In this series, we provide some benchmarks to monitor your progress along the way.

Retirement Savings Targets as a Multiple of Salary: Benchmarks, by age


How much should I have in retirement savings
Retirement Savings Targets as Multiple of Salary
This post is designed for those who do not expect to receive a pension or Social Security -- regardless of salary level. Otherwise, see with Social Security, or higher income earners.

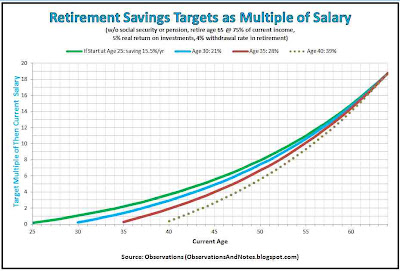
Without Social Security or a Pension, You'll Need ~19 Times Your Salary to Retire Comfortably at Age 65!


As you can see from the chart above (click to expand), no matter when you start saving, by the time you're 65 you'll need about 19 times your "then-current" salary in retirement savings! That is, assuming you want to maintain

Thursday, November 15, 2012

What Percent of Income Should High-Income Earners Save For Retirement?

Here's another easy-to-use graph that suggests the percent of your income to save for retirement depending upon the age you start saving. It's based upon the commonly used 4% withdrawal approach to retirement savings, and is designed for a high income wage earner planning to receive Social Security in retirement. Earlier posts targeted a typical social security recipient, and those without Social Security.

Some Benchmark Percents of Income to Save for Higher Income Earners with Social Security, by Starting Age


Retirement planning: what percent of salary should I save yearly (higher income w social security)
Annual Retirement Savings Percentage Needed (higher income)

Most people are not saving enough for retirement! Because of the way Social Security is designed, those with higher salaries need to save an even higher percentage of their salaries than the average person. Waiting too late to start planning & saving for retirement, or not saving enough, can be the difference between having a secure, comfortable retirement and a drastically reduced standard of living.

High Income Earners Should Plan to Start Early, and Save A Larger Percent of Their Annual Salary -- Even With Social Security

The previous post in this series benchmarked savings percentages needed for a typical worker with Social Security (and no pension). Unfortunately, the percentage of your salary that Social Security will replace decreases as your salary increases. As a result, higher income earners need to accumulate more years of salary in savings by their retirement date. Therefore, they should plan to save a larger percentage of their income than those with average salaries in order to reach the higher targets.

Thursday, November 8, 2012

What Percent of Your Income Should You Save For Retirement? (by starting age, with Social Security)

Here's an easy to use graph that suggests the percent of your income to save for retirement depending upon the age you start saving. It's based upon the commonly used 4% withdrawal approach to retirement savings, and designed for a typical wage earner who is planning to receive Social Security. Other posts address saving percentages for higher income earners, and those without Social Security. For other situations, see the end of this post.

Most people do not save enough for retirement. Sixty percent of older women have trouble covering their basic monthly expenses. Nearly half of Americans die with virtually no financial assets. Waiting too late to start planning & saving for retirement, or not saving enough, can be the difference between having a secure, comfortable retirement and spending your golden years in poverty.

Some Benchmark Retirement Saving Rates for Typical Employees with Social Security, by Starting Age


Retirement Planning:  what percent of salary should save -- by starting age
Annual Retirement Savings Percentage Needed (w Soc Sec)


Even With Social Security, You Will Need to Start Early, and Save A Significant Percent of Your Yearly Salary

The previous post in this series showed results for workers without a pension or Social Security. However, about 90% of American workers do have Social Security; it typically replaces roughly 40% of their pre-retirement income (not the at least 70% of pre-retirement income normally assumed to be needed). Even so,

Monday, October 22, 2012

What Percent of Your Salary Should You Save for Retirement? (by Starting Age)

Here's an easy-to-use graph that suggests the percent of your salary you should save for retirement depending upon the age you start saving. It's based upon the commonly used 4% withdrawal approach to retirement savings, and is independent of your salary. Waiting too late to start your retirement planning & saving, or saving too little, can make the difference between having a secure, comfortable retirement and spending your golden years in poverty.

What Percent of My Salary Should I Save for Retirement? Some Benchmarks by Starting Age


Retirement Planning: percent of salary to save each year -- by age you start saving
Annual Retirement Savings Percentage Needed
Note: This chart is for those who do not expect to receive Social Security. See also Percent to Save With Social Security, saving percents for higher income earners, and the final section of this post.

Start Saving & Investing When You Are Young, And Don't Invest Overly Conservatively

This graph (click to enlarge) proposes some benchmarks for those planning to retire without a pension or Social Security. While your specific circumstances may differ from what I have assumed (see "Key Assumptions" below), they won't change the basic messages that I think this chart sends, namely:
  • The earlier you start planning & saving for retirement, the better off you are (i.e., the less you will need to save each year)

Sunday, October 14, 2012

Using Your Android Phone GPS to Find Friends in a Crowd

How do you find your friends in a crowd of 75,000 people?

DRAFT

Tailgating at the Texans - Packers Monday Night Football Game

The Houston Texans have sold out every game in their 10-year history. Thus, the Texans-Packers Monday Night Football game will have over 70,000 football fans in attendance. Thousands of additional fans bought "tailgating" tickets, which admit them to the parking lot, but not the stadium itself. How do you find someone in that mass of humanity?

Don't Rely on Your Cell Phone

If you do not arrive at the parking lots with the rest of your tailgating party, finding them somewhere amidst 75,000 fans can be a problem. Under normal circumstances, you'd just whip out your handy cell phone and have them give you directions and describe key nearby landmarks. Unfortunately, this method may be problematical in this situation.

A crowd of 75,000 people in such a constricted area may well overwhelm the local cell phone tower capacity -- even with the additional capacity that the league trucks in for the occasion. It's very difficult to

Saturday, October 6, 2012

My All Ex-Houston Texans Team

All Ex-Houston Texans Football Team
Not many years ago, if a player couldn't make the Houston Texans, his chances of making some other NFL team were... well, let's say "slim."

How far the Texans have come! Now, the Texans see ex-Texans on the opposing side virtually every week -- often as starters. In fact, it occurred to me that you could put a pretty good football team together consisting only of current NFL players that the Texans had released. Here's my team (and where they are now).

My All-Ex-Houston Texans Team: Offense

  • QB: Rex Grossman (Redskins)
  • RB: Chris Ogbonnaya (Browns)

Wednesday, September 19, 2012

Syncing Android Contacts / Addresses With Your PC (MS Outlook)

This post describes a method for keeping Android contacts and MS Outlook/ PC contacts in sync that works for most Android smartphones.

In a previous post, I described the method I use for keeping my Android phone calendar in sync with my PC (Microsoft Office - Outlook). In this post, I'll describe how I keep the two address books in synch using a similar approach. (I cover both Jelly Bean and ICS)

Synchronizing PC (MS Outlook) and Android Smartphone Contacts (Address Books)


Synchronizing Android smartphone & PC (MS Office) contacts & addresses
Syncing Android & PC Contacts

As before, the key to this approach is to use my Google account as an intermediary. First I'll describe how I sync my Google Gmail contacts with my PC, then how I sync my Google Gmail contacts with my Motorola Droid RAZR smartphone.

Saturday, September 8, 2012

Houston Texans 2012: A Few Words of Caution

Less than two years ago, fans were calling for coach Kubiak's head; now the fans all seem convinced this is the year the Texans win the Super Bowl. I argued then that the fans were overreacting; they may be overreacting now as well.

Don't get me wrong, I've never been more excited about the Texans. For the first time, it's not ridiculous to put Texans and Super Bowl in the same sentence. However, I view us as contenders, not odds on favorites. It's far from a sure thing that the Texans will even get to the Super Bowl, let alone win it.

Two Concerns

One obvious concern is the right side of the offensive line. Both the guard, Antoine Caldwell, and the tackle, Derek Newton, are new. Derek Newton is a second year player who

Saturday, August 25, 2012

Build Your Own Pension Using Immediate Annuities


If you don't have a pension, or your pension is too small, consider creating your own pension using an immediate annuity (aka single premium income annuity).


Life Expectancies: Mortality Rates for 65 Year Old Males

mortality rates reason for immediate income annuities
Mortality Rates for 65 Year-Old Males


Here's another way to look at the life expectancy problem. The graph above shows the mortality rates for a hypothetical population of males who are exactly 65 years old. The bar at age 65 indicates that 1.7% of this group would be expected to die while still 65 -- i.e., before reaching age 66. The remaining bars show what percent of the original group is expected to die each succeeding year until age 100.

It's worth noting that

Wednesday, August 15, 2012

The Life Expectancy Problem: How Long Will You Live?

Being realistic about how long you will live, your life expectancy, can increase your chances of a successful retirement.

Life-expectancy: People are Living Longer

U.S. Life expectancy at birth (lifespan) since 1920
Life Expectancy In The United States

There is both good news and bad news about life expectancy. The good news is life spans are getting longer; life expectancy at birth has increased more than 15 years just since 1930. (see graph above. Click to expand.)

Increasing Life Expectancy is a Double-Edged Sword

The bad news is ... life spans are getting longer. One result of the dramatic decrease in mortality rates over the last century or so, is that retirees are spending more and more years in retirement. And, that means they are spending more and more years living off their retirement savings. While living longer is generally a good thing,

Saturday, July 21, 2012

Interest Rate Forecast for 5-Year Treasury Notes

In this post, we forecast the yields for five-year treasury notes/bonds over the next five years using the same technique we used in an earlier post. In the earlier post, Where Are Interest Rates Headed?, we used the current yield curve to derive the yield curve as it is expected to be one, two and five years in the future. In effect, this post takes the results from that post and looks at them through a different lens.

Market Forecast of Five-Year Interest Rates for Next 5 Years


Interest rate forecast for 5-year U.S. Treasury Notes/ Bonds
Market Forecast of Five-Year Interest Rates

In the graph above (click to expand) the solid blue line represents five-year U.S. Treasury Notes. Year zero shows the "current" yield of 0.68% (To be consistent with the graph in the previous post, "current" is as of June 15, 2012). The remaining points show the expected yield on five-year treasuries from one to five years in the future. The expected yields were derived from

Tuesday, July 10, 2012

My Dropcam HD Security Camera: A Quickie Review

To supplement my traditional alarm system I now have live, internet-accessible video and audio of my home via my hi-def Dropcam video camera.  Here's a quick review based upon about a week's usage.

Sample Dropcam HD (high definition) Video

internet-accessible security camera, room / baby / pet / sitter monitor
Sample Dropcam HD Video

What's a Dropcam HD Camera??

With my Dropcam video camera, even though I'm currently in New York City, anytime day or night I can pull out my Droid and get a live "hi-def" view of what's happening at my home in Houston (similar to the sample shot above). Not only that, but if there is movement or sound

Sunday, July 1, 2012

June 2012 Stock Market Update

Stock market (DJIA) monthly performance / closing prices for last 12 months
Dow Index Monthly Closes Through June, 2012


A Disappointing Second Quarter

June was actually a pretty good month.  On the final day of trading, the Dow was up 2.2%, rallying on good news from Europe.  However, it marked the end of a disappointing second quarter.  The market fell 2.5% during the quarter, primarily because of concerns about a) Europe, b) China, and c) the U.S. -- three of the most important drivers of the global economy.


An emerging domestic concern lately is the so-called "fiscal cliff" looming on

Friday, June 22, 2012

Where Are Interest Rates Headed?

This post describes a methodology for using the current yield curve to forecast future interest rates.

In the current economic environment, the direction of interest rates is a critical issue for many investors -- especially for retirees. You probably know that you can use the yield curve to forecast the direction of the economy. But, did you know that you can also use the current yield curve to forecast the shape of the yield curve one, two or three years or more in the future? Read on.

The Bond Market's Forecast of Interest Rates 1, 2 & 5 Years From Now

Future interest rate forecast: Yield curve 5 years from now
Market Forecast of Future Yield Curve/ Interest Rates


In the graph above (click to expand), the heavy black line is the current yield curve (as of June 15, 2012). The other three lines are the yield curves as they are expected to be 1, 2 and 5 years in the future. The shape of the future yield curves was derived directly from the current yield curve.  As you can see from the chart, the forecast is for rates to remain depressed, even as they rise gradually over the next five years. Two years from now (the green line), the one-year rate is forecast to be barely above 0.5%; five years from now (the dotted red line), the five-year rate is forecast to still be less than 3%.

Deriving Future Yield Curves From the Current Yield Curve

To understand how this model/spreadsheet works, consider the following. If we know the current one year interest rate and the current two year interest rate, we can calculate

Friday, June 15, 2012

Syncing Android Calendars with PCs (MS Outlook)

This post describes a method for keeping Android calendars and MS Outlook PC calendars in sync that works for most Android smartphones. {Note: The Google Calendar Sync software described in this post has been discontinued.  Instead, consider the software described in the contact sync post. Please leave a comment if you have found an even better alternative.}

My Motorola Droid RAZR has been a valuable addition to my computing capabilities. However, my desktop PC is still the center of my computing world.  With the advantages of multiple computing platforms comes the burden of keeping Microsoft Office in sync with my phone. This post describes how I synchronize my calendars/ appointments.  (procedures are included for Jelly Bean, ICS (ice cream sandwich), and Gingerbread)

Synchronizing PC (MS Outlook) and Smartphone Appointments: Using Google Calendar as an Intermediary

synchronizing Android smartphone appointments & calendars with PC (MS Outlook) calendars / appointments
Syncing Android Smartphone & PC Calendars

The key to this approach was to use my Google calendar as an intermediary. Since all Android phones can communicate with Google/Gmail accounts, and Google accounts can communicate with Microsoft Outlook, all Android phones should be able to communicate with MS Outlook. First we'll look at syncing the Google calendar with the Outlook calendar, then syncing the Google calendar with the phone calendar.

Sunday, June 3, 2012

May 2012 Stock Market Update

Stock market (DJIA) monthly performance / closing prices for last 12 months
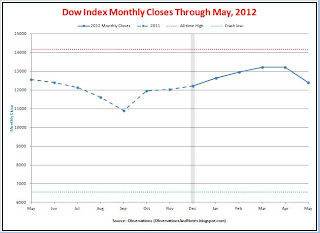
Dow Index Monthly Closes Through May, 2012


Ugly

A month ago, I reported that we had just completed a month that, for all intents and purposes, ended right where it started.  Not the case this month. This month was -- ugly.  It started with a new 52-week high on May 1, and then went south. The first half of the month was characterized by continuing concerns about Europe.  By the end of the month, the concerns were much closer to home given increasing evidence that the recovery may be stalling.

The result was a month awash in red. For the whole month of May, there were only five days when the market finished in the black. Predictably, there was another rush to treasuries.  So much so that by the end of the month the 10-year note had established a new all-time low;

Monday, May 28, 2012

Choosing Apps for My First Smartphone

My New Droid RAZR

Well, I finally decided to replace my nearly 10-year old flip phone. Even though you could make a strong case that my Virgin Mobile pre-paid flip phone was already overkill for me, I finally tossed the flip phone and upgraded to a Motorola Droid RAZR.

Android smartphone apps & widgets for Motorola Droid RAZR
Motorola Droid RAZR

My home phone is still my primary phone; my mobile phone doesn't get very much use. So, if the increase in the cost of my mobile phone service from $5 to close to $80 a month is going to be worth it, the increase will have to be justified by apps, not phone calls. Here are the apps that I have so far.

Droid RAZR Home Pages 

The Droid RAZR has five home pages that you can use to organize your apps.  Each of my home pages has a theme: communications, social networking, productivity, entertainment or phone utilities.  I describe each of these home pages in more detail below.

Friday, May 18, 2012

The 2011 10-Year Stock Market Projection

Note: The purpose of this post is just to archive the original 2011 projection for posterity. For the current yearly projection, see The 10-Year Stock Market Projection. The original post for 2011 follows....


This post presents projected stock market returns for the "next" 10 years -- beginning in January 2011. It also shows the actual results for the most recently completed 10-year period.

Projected 10-Year Stock Market Returns


Stock market (Dow Jones Index) forecast for next 10 Years performance /returns

The above graph (click to expand) shows my projected returns for the DJIA (Dow Jones Industrial Average) for 10-year periods beginning end-of-year 2000 through 2010. The dotted red line estimates the return that a hypothetical investor in the stock market would receive over the next ten years if he

Wednesday, May 2, 2012

April 2012 Stock Market Update

Stock market (DJIA) monthly performance / closing prices for last 12 months
Dow Index Monthly Closes Through April, 2012

A Flat Month

After establishing a new 52-week high on the first trading day of the month, stocks skidded.  Poor employment numbers and renewed worries about Europe (Spain this time) resulted in five straight down days.  These were more or less offset by four straight up days at the end of the month.  Bottom line? We ended one and a half points from where we started.

Sunday, April 15, 2012

Housing vs. Stock Market Growth Revisited

Devising a way to make a simple, fair, high-level comparison between housing and stock investments is more difficult that you might think. This post is my second attempt to develop such a comparison.

U.S. Housing vs. Stock Market Price Growth

DJIA (Dow Index) growth vs U.S. residential real estate / housing growth since 1900
U.S. Housing vs. Stock Market Appreciation

In the above graph (click to expand) the blue line shows Shiller's nominal home price index, treating 1900 as 100. As a reminder, Shiller's methodology attempts to track the price of a home of constant size and quality; it adjusts out the upward price drift caused by the average home becoming larger and more feature-rich over time. The red line represents yearly closing prices of the Dow Jones Industrial Average (DJIA) -- again treating 1900 as 100.

In both cases, we're using nominal, "then current," dollars -- i.e., I have not adjusted for inflation. In both

Sunday, April 1, 2012

March 2012 Stock Market Update

Stock market (DJIA) monthly performance / closing prices for last 12 months
Dow Index Monthly Closes Through March, 2012

Dow Approaching All-Time High

Well, maybe I'm a touch premature, but consider this.... the Dow set another 52-week and multi-year high on March 15. To top this high, you'd have to go all the way back to 2007 -- back to early in the descent from the all-time peak established on October 9 of that year. That shows you how far we have come in the three short years since the market bottomed in March of 2009. The Dow has more than doubled since its lows of 2009, and is now

Sunday, March 25, 2012

Initial P/E Ratio vs. 1-Year Stock Market Returns

This is the last in a series on the relationship between the P/E ratio at the time of purchase and the stock market returns that follow.

Previous posts have analyzed returns for the ensuing 20 years, 10 years, and 5 years. This post concludes the series by looking at returns for one year.

Scatter Diagram: Initial P/E Ratio vs. 1-Year Stock Market Performance 

Scatter diagram: initial P/E ratio, 1-year stock market return/performance
Starting P/E Ratio vs. 1-Year Returns

The above scatter plot (click on image to expand) shows the historical relationship between the price/earnings ratio of the stock market at the time of purchase and

Thursday, March 15, 2012

The Impact of Starting P/E Ratio on 5-Year Stock Market Returns

In this post, we'll look at the impact of P/E ratio at time of purchase on subsequent 5-year stock market performance. Previous posts in this series presented the results for 10 years and for 20 years.

Scatter Diagram: Initial P/E Ratio vs. 5-Year Stock Market Performance


Scatter diagram: initial price/earnings ratio, 5-year DJIA/stock market performance

The above scatter plot (click on image to expand) shows the historical relationship between the price/earnings ratio of the stock market at the time of purchase and the market's return over the next 5 years. In the chart, each dot represents

Wednesday, February 29, 2012

February 2012 Stock Market Update

Stock market (DJIA) monthly performance / closing prices for last 12 months

Dow Testing 13,000

In February, the Dow reached not only a new 52-week high but a multi-year high, besting 13,000 for the first time since May 2008. After failing multiple times, the Dow finally closed above 13,000 on February 28th, but couldn't hold on through month-end.

The lack of market volatility continued. Again there was not a single +/- 2-3% day, and only once did the Dow move more than 1%. The DJIA (Dow Jones Industrial Average) just quietly continued its apparently inexorable march upward, ending the month

Wednesday, February 22, 2012

Why Mutual Fund Owners Earn Lower Returns Than The Funds They Own(!)

Mutual fund owners earn lower returns than their funds report. And, it's not because the funds are lying.

In an earlier post we saw that investors earn significantly less than the theoretical, published overall market returns. In this post we'll see that they also earn less than the published returns for the funds that they actually own! How can that be? Read on.

Mutual Fund Returns vs. Investor Returns (aka Dollar-Weighted Returns)


investor returns, asset-weighted and dollar-weighted returns

The graph above (click to expand) shows that between 1991 and 2010 the return for the average stock fund was 9.9% per year. For this same period, the average stock fund investor earned just

Tuesday, February 14, 2012

The Easiest Way to Increase Investment Returns? Reduce Expenses!

This post highlights the huge impact that just one or two percent in yearly expenses can have on your long-term investment performance. The impact is the same for bonds as it is for stocks.

A previous post discusses expenses that reduce the theoretical, published investment returns -- including taxes, commissions & loads, mutual fund expense ratios, and trading costs. In that post, we saw that these expenses could cut the size of your retirement portfolio in half! Frankly, I was surprised at the magnitude of the impact. How can shaving only one or two percentage points off your annual return have such a huge impact? Read on.

The Impact of an Additional 1% in Annual Return on Investment (ROI)


Impact of expenses on stock and bond market investment returns

The above chart (click to expand) shows

Wednesday, February 1, 2012

January 2012 Stock Market Update

Stock market (DJIA) monthly performance / closing prices for last 12 months

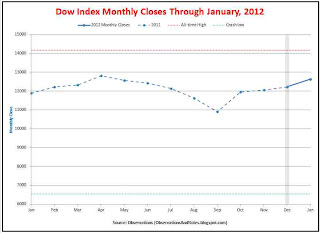
U.S. Markets Off to Solid Start

The turmoil in Europe continues. In January, S&P downgraded the debt of nine of the Euro countries. Among the downgrades was a downgrade of France from AAA to AA+. U.S. markets shrugged off the continuing concerns about Europe and delivered their best January performance in 15 years.

The volatility that characterized 2011 was nowhere to be seen; there was not a single +/- 2-3% day. Only once did the Dow move more than 1% -- a 1.5% increase on the first trading day of the year. Instead, there was a calm, and reasonably steady, upward progression. The DJIA (Dow Jones Industrial Average) ended the month

Saturday, January 21, 2012

"Too Big to Fail" Assures Bigness - and Failure

Guest post by Tom Evslin

This article was originally posted on Tom's blog, Fractals of Change, on 11/15/11
Tom Evslin of Fractals of Change

Reader Bobsv57 asks:

"Tom, a question for you. I am under the impression that most, if not all, of the money used to bail out banks has been paid back with interest and it is actually the money used to bail out GM that hasn't been returned. Am I correct in this observation? and if I am, then why to you make the statement calling for no more bank bailouts? (Not that I particularly support them in any case) It would seem that the bail out was a money maker for the Fed, wasn't the interest they charged the banks for TARP funds greater than the interest the Fed pays on it's national debt?"

Bob is right that the banks paid back their loans with interest. But the eventual cost of the bailout is likely to be the failure of our banking system and massively increased public debt. Meanwhile, middle America is starved for credit while the "too big to fail" banks are getting bigger at the expense of their better managed smaller and safer brethren.

An article in the Wall Street Journal explains one way that corporations are positioning themselves for the next credit crisis:

Saturday, January 14, 2012

The Houston Texans Strategy is Paying Off

Houston Texans NFL football strategy
It probably won't surprise readers of this blog to hear that I like to approach football from a strategic point of view. I avoid being frustrated by our quarterback's latest interception, or our running back's latest fumble by focusing on the bigger picture -- where do we stand compared to our strategic plan?

The Vision: Sustainable Excellence

My vision for the team is what I would call "Sustainable Excellence." By that I mean a team that is consistently among the best in the National Football League (NFL). It's a team that consistently makes it to the playoffs, and sometimes wins the Super Bowl. I firmly believe that is the organization's vision as well. And, I believe we're on the right track.

Clearly, one key to realizing that vision is getting the right people. Let's look at some aspects of the Texans' "people" strategy.

Monday, January 2, 2012

Stock Market Total Returns through 2010

Last year, I archived the "Stock Market Returns through 19xx" post so that the results through year-end 2009 would continue to be available. Based upon the interest in that post, it seems worthwhile to continue the practice. So, for interested readers, following is my archive of market total returns through 2010.

Stock Market Total Return Results Through 2010

  • Since 1900 (end-of-year 1899), through 2010, I estimate the average total return/year of the DJIA (Dow Jones Industrial Average)  was approximately