U.S. Markets Off to Solid Start
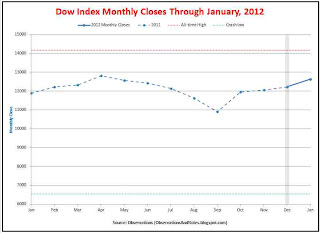
The turmoil in Europe continues. In January, S&P downgraded the debt of nine of the Euro countries. Among the downgrades was a downgrade of France from AAA to AA+. U.S. markets shrugged off the continuing concerns about Europe and delivered their best January performance in 15 years.The volatility that characterized 2011 was nowhere to be seen; there was not a single +/- 2-3% day. Only once did the Dow move more than 1% -- a 1.5% increase on the first trading day of the year. Instead, there was a calm, and reasonably steady, upward progression. The DJIA (Dow Jones Industrial Average) ended the month at 12,632.91 -- within hailing distance of a new 52-week high. (See chart above. Click to expand.)
Where are we Now? January, Year-To-Date & Recovery-To-Date Review
Here's where we stand vs. some key dates and milestones:- From All-Time High of 14,165 on Oct 9, 2007: the Dow is down 1532 points (10.8%)
- From Crash Low of 6547 on March 9, 2009: Up 6086 points (93.0%)
- From one year ago close of 11,892 in January, 2011: the Dow is up 741 points (6.2%)
- From the New 52-Week High of 12,811 on April 29, 2011: down 178 points (1.4%)
- From the New 52-Week Low of 10,655 on October 3, 2011: Up 1978 points (18.6%)
- First Quarter & Year-to-Date From 2011 close of 12,218: The Dow is up 415 points (3.4%)
- From Prior Month Close of 12,218: Up 415 points (3.4%)
Note: At the end of the crash, the Dow had lost about 54% of its value (from the all-time high). For an explanation of how it can be up over 90% since then and still be below the all-time high, see The Importance of Avoiding Large Losses.
The Next 10 Years
My stock market projection model continues to project below average 10-year returns. The preliminary 10-year projection is in the neighborhood of 5.0%/year. Since my model is earnings based, I'll have to wait for 2011 earnings data before finalizing the projection. I'll post a formal update around the end of the first quarter.Related Articles & Posts
100 Years of Stock Market History: Bigger perspective on "Where are we Now?." Includes 100-year chart and discussion of the long flat periods.Dow Yearly Returns: 1929-2011 : bar graph of yearly total returns (i.e., including dividends)
What has the range of returns (minimum & maximum) been for 1,2, 3, ... 100-year periods?
10-Year Stock Market Projection shows how expected returns have changed over the last 10 years.
100 Years of Interest Rate History: graph of Treasury Note interest rates since 1900
Who's Afraid of a Sideways Market?: Interesting perspective on long flat periods from Morningstar.
Three Scenarios for the Economy (and the stock market) includes links to additional relevant articles by Bill Gross, Nouriel Roubini, Jeremy Grantham, John Hussman, and others.
For lists of other popular posts and an index of stock market posts, by subject area, see the sidebar to the left or the menu bar at the top.
Copyright © 2011. Last modified: 2/29/2012

No comments:
Post a Comment
No spam, please! Comment spam will not be published. See comment guidelines here.
Sorry, but I can no longer accept anonymous comments. They're 99% spam.